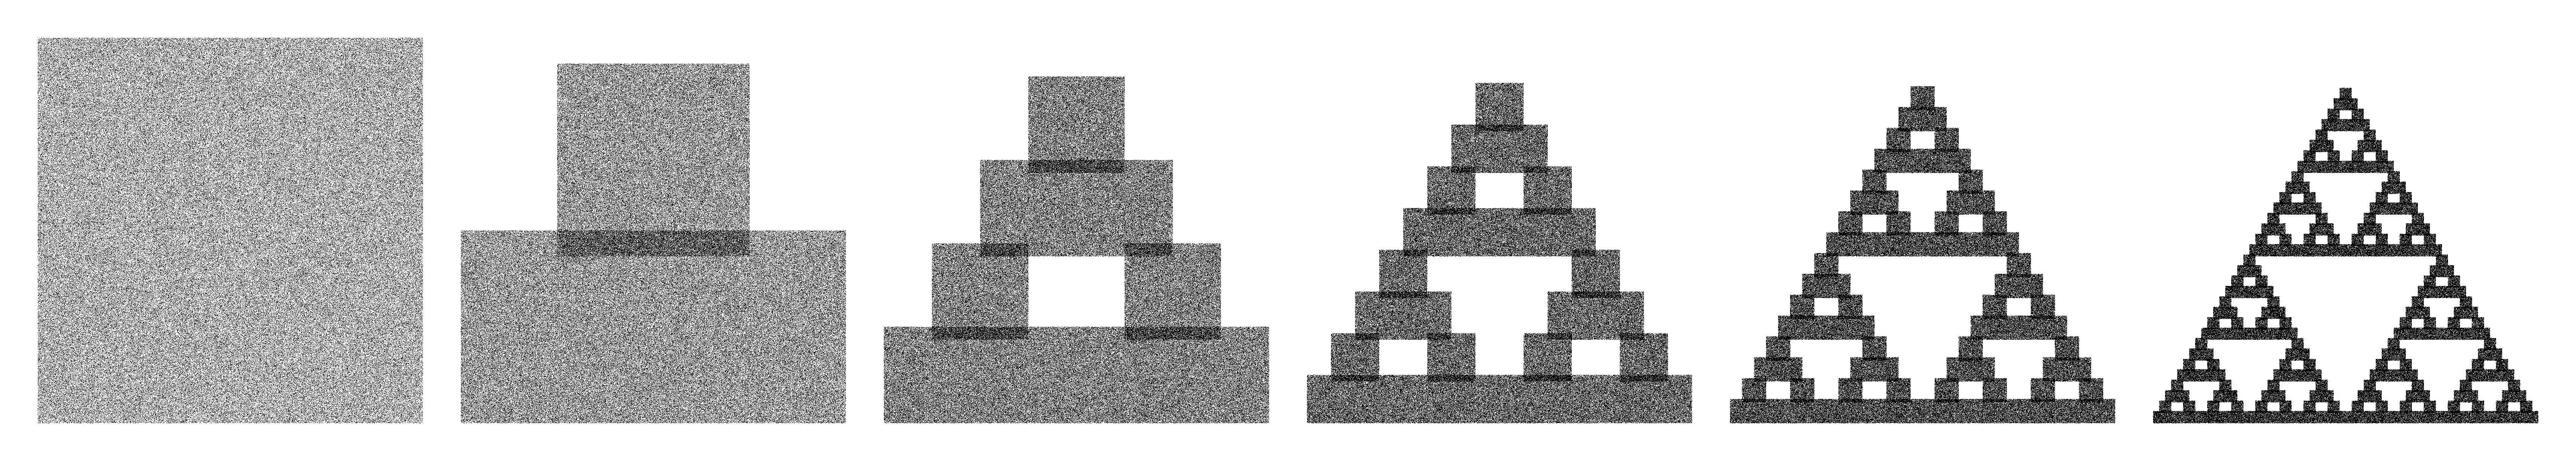
IFS stages of the Sierpinski triangle
In this workshop, we learn to make fractal art with iterated function systems. We use Python and gnuplot to turn math into pictures. I will not teach programming from scratch; instead, we start with code examples and modify them to make different pictures.
IFS stages
of the Sierpinski triangle
Open the image in the web browser: File -> Open file... or from the terminal "firefox ifs.png &". You can keep it open and reload it by pressing F5 after you modify it.
Open the file ifs.py in an editor, for example "gedit ifs.py &". Try modifying some of the functions s1, s2 and s3. For example, change a shift of 0.5 into something else. Try small changes at first.
To run the necessary commands at once, type "python ifs.py && gnuplot ifs.plot". See how the change in functions shows up in the picture.
When you find a really nice picture, save a copy of the Python file in a different file: Save as... / Tallenna nimellä... with a descriptive name, like splash.py. Then you can open the original file (e.g. ifs.py) and keep editing, while keeping the other file.
Extra: can you modify the triangle to make it equilateral? You may need the square root function, for example math.sqrt(3) for √3.
The first example only has shifts, but we often need rotations too. The file ifs-swirl.py has a rotation function and another example. Try it with "python ifs-swirl.py && gnuplot ifs.plot" and try some changes too, for example different angles of rotation.
Remember that in mathematics, a positive rotation means counterclockwise.
Hint: angles like 45, 60 or 90 degrees make sharp and blocky results. They are simple fractions of a full circle, so after a few iterations they return to the same position. For more organic shapes, use other angles like 18.12 degrees.
So far, we have plotted only the final iterates. In my colour method, we plot some of the earlier stages as well, each with a different colour. The coordinates of different stages go to their own .dat files.
In the graph, you now have more points in total, so you can either use fewer initial ones (ninit = ... in Python) or smaller points (plot ... pt 0 in gnuplot).
Example: python ifs-stages.py && gnuplot ifs-stages.plot
The example uses all stages, including the initial points. You can also leave out some stages, for example use only stages 6 to 10. For this, edit the .plot file.
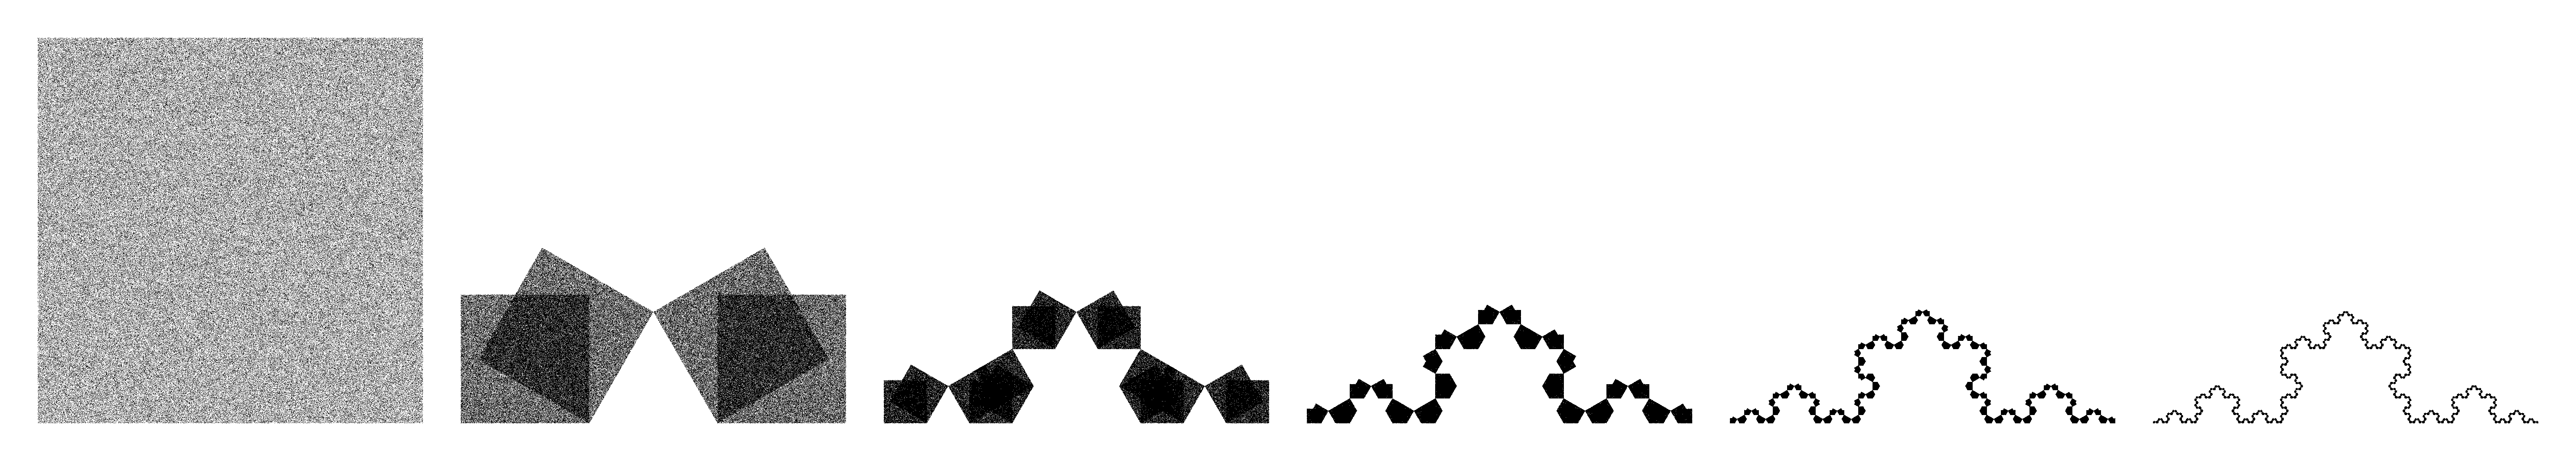
IFS stages
of the Koch snowflake
While multiple colours are nice, some pictures may work better in simple black-on-white — like pencil drawings. (See some of my works for example.)
After finishing your artwork, send me
heatmap-complex.py
heatmap.plot
heatmap.py
ifs-koch.py
ifs-stages.plot
ifs-stages.py
ifs-swirl.py
ifs.plot
ifs.py
orbit.plot
orbit.py
© Risto A. Paju, distributed under the GNU General Public License - Version 3, 29 June 2007.